Center for Community Support and Development Studies, Real-Time Analytics and United Nations Development Program
 |
| Staff of Long An Provincial Public Administration Service Center guide people to submit online applications__Photo: Duc Hanh/VNA |
Introduction
This article provides insights into how citizens have experienced access to the internet, e-government and online public services since 2016, when the Provincial Governance and Public Administration Performance Index (PAPI)[1] started measuring e-governance performance. It provides an overview of e-governance performance at the provincial level in 2023, comparing it with the previous three years. It then presents citizens’ assessment of the National E-Service Portal - NESP and Provincial Online Public Service Portals (or Provincial E-Service Portal - PESPs) from their own experiences, before examining the existence of the “digital divide”[2] in citizen access to e-services at central and provincial levels among different population groups. This will help inform central and local governments of who is left behind in their digital transformation endeavors.
The findings, which form PAPI’s “E-Governance” dimension, are important, considering the Vietnamese Government’s recent push to expand digital government and citizenship. After approving in 2020 the National Digital Transformation Program by 2025, with orientations toward 2030[3], the Prime Minister in January 2022 issued Decision 06/QD-TTg[4] approving a scheme for the application of data on population and electronic identification and authentication as part of the national digital transformation during 2022-25 (with a vision toward 2030). Then in June 2022, the Government issued Decree 42/2022/ND-CP[5] regulating the provision of information and public services online by state agencies. The decree requested central and local government agencies to digitalize different public administrative procedures and urged citizens and businesses to use central or provincial e-service portals. Also, under the 2023 National Digital Transformation Action Plan,[6] Vietnam aimed to bring 50 percent of administrative procedures online, complete the information system for managing administrative procedures in all ministries and provinces and integrate it into the NESP and increase the proportion of online payments for administrative procedures through the NESP to 60 percent by the end of 2023. All these endeavors are expected to reduce bureaucratic discretion and corruption, improve transparency and enhance government efficiency. The PAPI indicators aim to track the performance of such policies from citizens’ experience.
Overview of e-governance performance at provincial level in 2023
This section presents key findings from citizens’ assessment of e-governance performance in 2023 with a comparative perspective of such views since 2019, when the NESP was launched, for two primary reasons. First, one area that witnessed significant improvement in PAPI’s dimensional scores in 2023 was E-Governance (Dimension 8).[7] Second, e-governance is a potential force multiplier for better governance. If a province can improve its e-governance performance, this could enhance transparency, reduce corruption and expedite administrative procedures. Transparency in local decision-making may be facilitated by improvements to e-governance platforms, including government portals and provincial e-service portals. E-governance is critical to allow citizens to bypass cumbersome red tape that can impede smooth access to government services.
Results from the 2023 PAPI survey saw improvements in the E-Governance dimension compared to the previous three years from 2020 to 2022. As Figure 1 shows, the two sources of improvements at the nationwide aggregate level are increased access to the internet and enhanced access to provincial e-governance portals. On a scale from 0.33 to 3.34 points, the sub-dimensional score for Access to Internet increased from 2.04 in 2020 to 2.39 in 2023. On the same scale, the sub-dimension Access to E-Governance saw a rise from 0.4 to 0.48 point, although at a much lower pace compared to the Access to Internet sub-dimension. Nonetheless, the sub-dimension E-Responsiveness of Authorities (about how local governments respond to citizens’ feedback and requests online) remained constantly low over the four years.
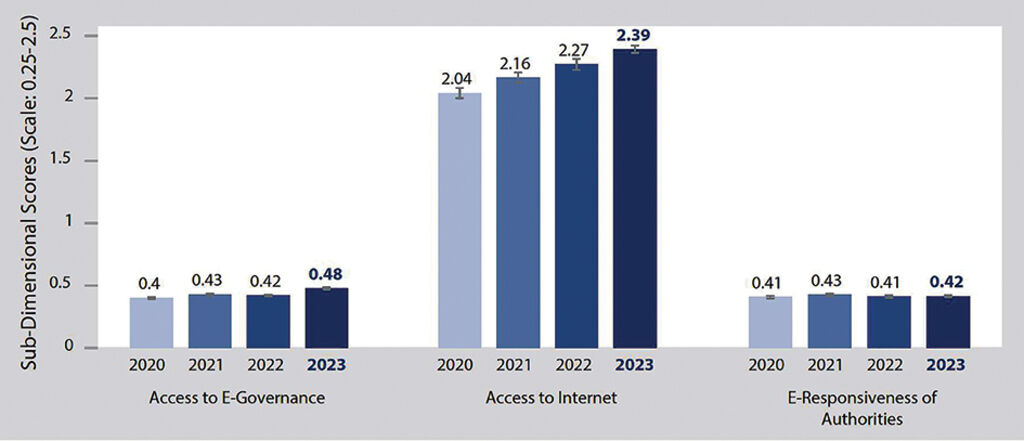 |
| Figure 1: Changes in e-governance performance at the aggregate level, 2020-23 |
Each year since 2016, PAPI has measured citizens’ access to the internet at home and access to news from the internet through a computer or smartphone. As Figure 2 reveals, more citizens have gained access to the internet and news online over the years. In 2023, nearly 80 percent of PAPI survey respondents said they had access to the internet at home, more than double the figure of 31 percent in 2016. Similarly, the percentage of respondents reading news from online sources almost tripled after eight years, from 23 percent in 2016 to nearly 59 percent in 2023.
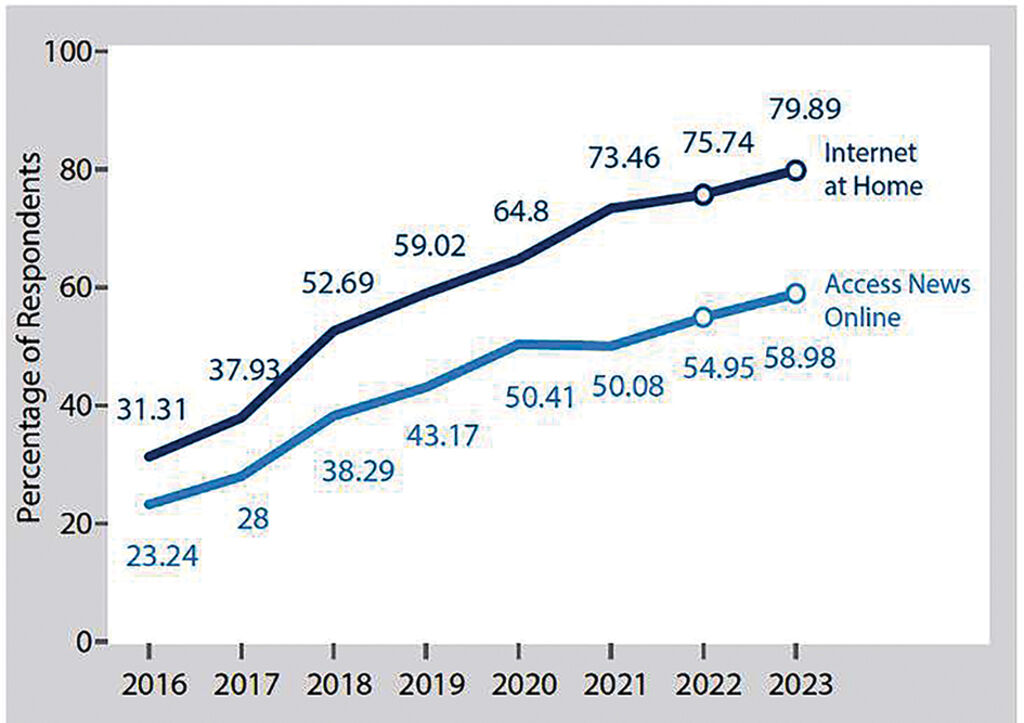 |
| Figure 2: Access to news online and access to internet at home, 2016-23 |
Is there a “digital divide” in access to the internet demarcated by gender, place of residence, ethnicity or migrant status? The 2023 PAPI surveys explored citizens’ access to the internet at home, personal computers and smartphones by different demographic features since 2016. The findings[8] reveal real divides in access to all these essential connection facilities and devices within each group.
In terms of internet access, while men and women had increasing access to the internet, a persistent 5-10 percentage point gap favors men over the years. Similarly, ethnic minorities had a constant 10-20 percentage point lower level of access compared to the Kinh majority. One area of convergence in 2023 was between rural and urban areas. Whereas the urban and rural gap exceeded 25 percentage points in 2016, it had shrunk to 9 percentage points in 2023. When comparing the internet access at home between non-permanent residents in the 11 largest recipient provinces of internal migrants (destination provinces) against permanent residents in these same provinces, the number of permanent residents with access was about 5 percent greater than non-permanent migrants over the three years from 2021 to 2023.
Regarding ownership of personal computers such as desktops or laptops at home, the PAPI findings show that there have been constantly larger gaps between urban and rural residents, Kinh and non-Kinh citizens as well as permanent and non-permanent residents at the national aggregate level, despite some converging trends toward 2023. The divide between women and men in ownership of a personal computer remains, although smaller compared to other three groups under discussion. When comparing access to personal computers between permanent and non-permanent respondents in destination provinces, the percentage of the former group was 13 percent higher than the latter group in 2023. Meanwhile, personal computers still play an essential role in facilitating access to e-services as both national and provincial e-service portals require that users of most administrative services fill in and sign application forms offline before scanning and uploading online - a process that needs to be done on a personal computer that is connected with a printer, a scanner and the internet.
With 90.8 percent of respondents in the 2023 PAPI survey reporting they had smartphones, it is important to spotlight any gaps in smartphone ownership. The 2018-23 PAPI survey findings show that, among the three connection conditions (i.e., internet connection, personal computers and smartphones) that can be used for online news and e-services, the level of smartphone ownership tends to be equally distributed across each of the four population groups being examined and has been on a converging trend toward 2023. Permanent and non-permanent residents in destination provinces were virtually indistinguishable in their level of smartphone access. The largest smartphone ownership gap is seen between the Kinh majority (92.96 percent) and ethnic minorities (86.88 percent). Smartphones can, therefore, be utilized to enhance the use of public e-services among Vietnamese citizens considering its national coverage. Growth rates in smartphone ownership have been impressive, particularly in rural areas and more difficult-to-access locations.[9]
The second area of improvement was access to information about citizen-centric administrative procedures, including government certification and land use rights certificates (LURCs) on public e-service portals that PAPI has measured since 2016. This sub-dimension explores whether citizens can find information about administrative procedures and application forms required to obtain government certification services or LURCs from local governments’ online portals. Figure 3 shows an increase in the number of respondents who applied for government certification services and could find some information about procedures and forms from online local government portals from 2016 to 2023. Particularly, there was a significant leap from 14.6 percent in 2022 to 20.4 percent in 2023. Access to information from local government platforms for LURC application procedures was more constrained and stagnated at around 12-14 percent from 2020 to 2023.
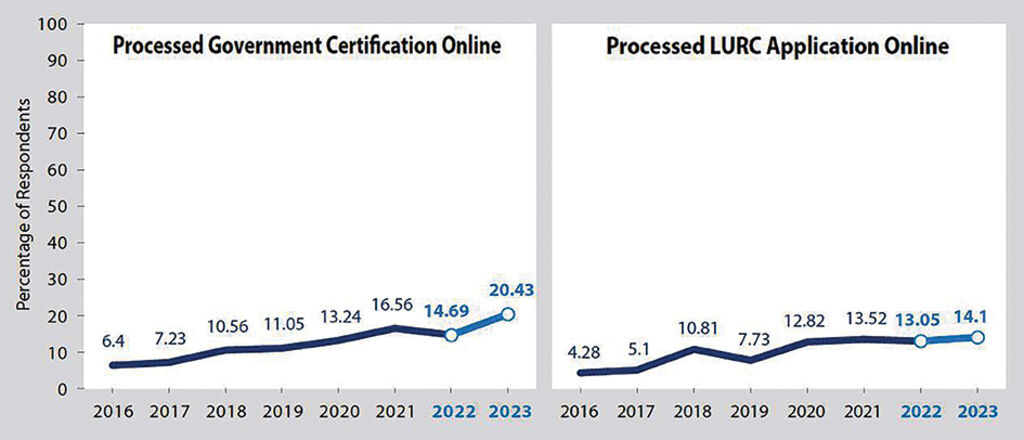 |
| Figure 3: Access to information and forms for government certification and land use rights certificates on online local government portals, 2016-23 |
An e-governance service with much less improvement is local government portals. While these portals are mandated to act as information gateways for citizens, findings from PAPI surveys from 2020 to 2023 as presented in Figure 4 show extremely low proportions of users. Only 2.44-3.06 percent of respondents reported using local government portals, even during the peak of the COVID-19 pandemic in 2021. Among those who used the portals, only 26.4 percent found them user-friendly in 2023, lower than nearly 32 percent also in 2021, when citizens possibly used the portals to search for local government COVID-related guidance or policy updates.
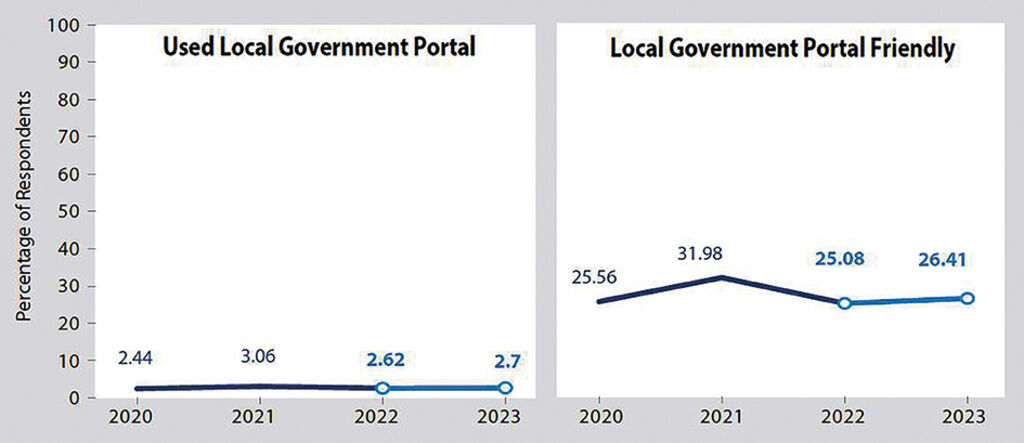 |
| Figure 4: Users and users’ assessment of local government portals, 2020-23 |
Accessing information and forms for public administrative procedures via online local government portals makes up only one level of e-governance, that is the transmission of information and forms. For effective e-governance, it must involve citizens in online discussions of draft policies via government portals as regulated in the 2015 Law on Promulgation of Legal Documents.[10] Since 2020, PAPI has asked citizens if their local governments publicized draft policies on provincial government portals for comment and if they were received in each year’s survey. Figure 5 reveals a declining percentage of citizens saying the draft documents were online for public consultation. The number dropped from a peak of 62 percent in 2021 to 52 percent in 2023. The number of those saying their comments were responded to remained steady at around 14 percent after four years.
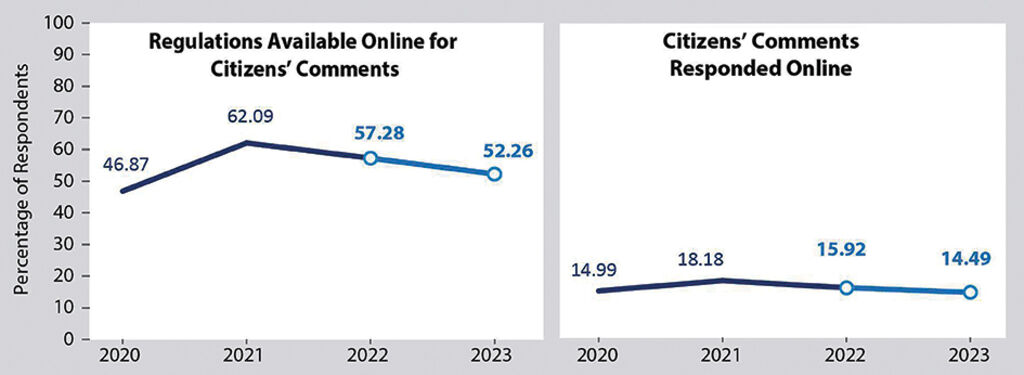 |
| Figure 5: Government’s publicization of draft regulations and responses to citizens’ comments online, 2020-23 |
Provincial and National E-Service Portals: levels of performance and emerging digital divide issues
As mentioned above, after the launch of the NESP in late 2019, and the government’s push for strengthened and NESP-linked e-services through PESPs, PAPI has been measuring citizens’ experience with the NESP and PESPs since 2020. In fact, as presented in the previous section, several e-service functions have been included in the PAPI survey since 2016. Now that all 63 provinces have designated PESPs that should be linked with the umbrella NESP since 2022, it is important to review their performance and accessibility from users’ experience. Thus, this section presents key findings on what citizens as users had to say about their experiences with the NESP and PESPs in 2023. It also reveals an important digital divide facing groups of users with different demographic backgrounds that central and provincial governments should address.
As shown in Figure 6, out of 18,919 respondents in the 2023 PAPI survey who responded to the questions about the NESP and PESPs, the number of the NESP users was 1,743 (8.3 percent) and that of PESP users from 61 provinces[11] with qualified data totaled 1,680 (7.6 percent). Given the small numbers of users, it is important to track how the NESP and PESPs perform in the interest of users as citizens from every walk of life. Among those who said they used the NESP during the year, 53.6 percent performed administrative procedures for themselves or their families. The percentage of PESP users for handling administrative procedures was 45.3 percent. The satisfaction levels for both national (NESP) and provincial (PESPs) were high at 88.7 and 94.3 percent, respectively. It is necessary to note that users of the NESP are also users of PESPs because the NESP plays the role as the landing page to connect with PESPs.
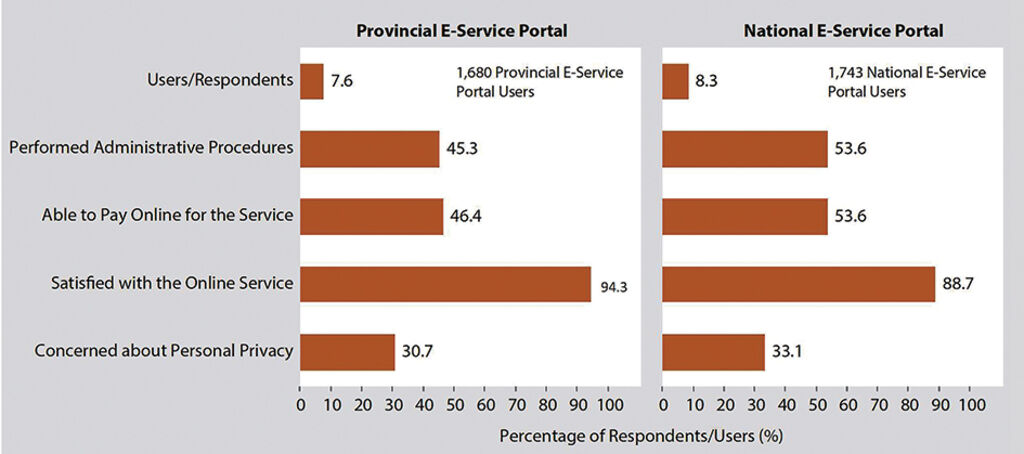 |
| Figure 6: Users of and their experiences with National and Provincial E-Service Portals, 2023 |
Full, all-rounded e-services allow citizens to complete processes for handling administrative procedures entirely online. This allows citizens to expedite the processes of acquiring needed certifications, while enabling them to circumvent red tape and bribery that too often occur during in-person interactions with civil servants. Figure 6 also indicates that, among those doing administrative procedures online, 53.6 percent could pay for the service online on the NESP, while only 46.4 percent of PESP users could. These percentages fell short of the 2023 target of 60 percent as committed in the 2023 Action Plan of the National Steering Committee for Digital Transformation.[12]
Apart from sub-optimal online payment facilities offered by the NESP and PESPs, another reason for the low numbers of users was their privacy concerns, as expressed by one-third of users of the NESP (33.1 percent) and PESPs (30.7 percent). Indeed, this further consolidates findings from the 2022 review by the Institute for Policy Studies and Media Development (IPS) and UNDP, which revealed local governments’ substandard performance in personal privacy protection on government-citizen interaction interfaces.[13] Hence, protecting users’ personal privacy and emphasizing it publicly are areas that need further strengthening from the central government to promote use of this modern platform. Moreover, there are other areas to address, including accessibility and user-friendliness of the government e-service portals and their functions as suggested in the series of e-governance research studies from 2021 to 2024 by UNDP and national partners.[14]
Citizen experience with processing administrative procedures on Provincial E-Service Portals
For the first time, the PAPI survey in 2023 asked whether citizens could process applications for the four public administrative procedures (government certification, LURCs, criminal records certificates, and personal papers) through PESPs. Figure 7 shows the percentages of those handling the four procedures and submitting applications through PESPs. It reveals that those applying for criminal records certificates (processed by provincial-level Departments of Justice) were most likely to submit applications through PESPs (28.7 percent), while only 11.9 percent applied for government certification. LURCs (processed at district-level governments) and personal papers (such as birth, death and marriage certificates processed by commune-level governments) were still largely paper-based, with around 5 percent saying they could submit applications through PESPs for each procedure.
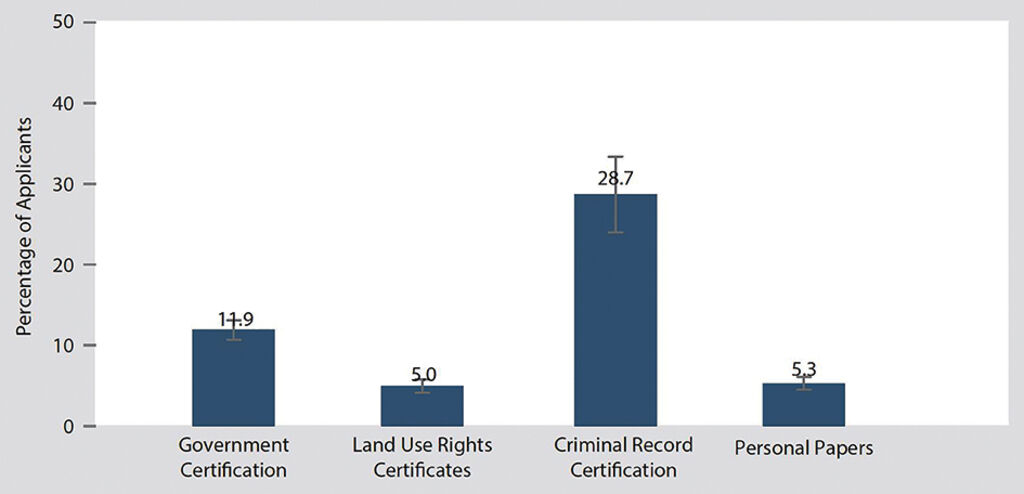 |
| Figure 7: Percentage of respondents able to submit applications for administrative procedures on Provincial E-Service Portals, 2023 |
The survey also assesses how age impacts the use of e-services. It is hypothesized that younger users are more comfortable with administrative services online. Interestingly, the 2023 survey results reveal that age does not impact use linearly. Figure 8 shows that, among 1,680 respondents who used PESPs in 2023, upon aggregated by age bracket, the oldest respondents (above 60 years old) were somewhat less likely to submit applications online. However, those in the oldest bracket who submitted applications through PESPs were less likely to face difficulties, possibly because they received direct support from one-stop shop (OSS) civil servants. The youngest respondents (below 25 years old) were also less likely to submit procedures online than the middle two age brackets (26-40 and 41-60 years old). However, younger ones more commonly faced difficulties. This suggests that the above 60-year-old users may have received more support from civil servants, youth unions or village digitalization support teams as part of the ongoing policy to support older e-service users[15] when processing administrative procedures, while younger citizens were left to process e-services themselves.
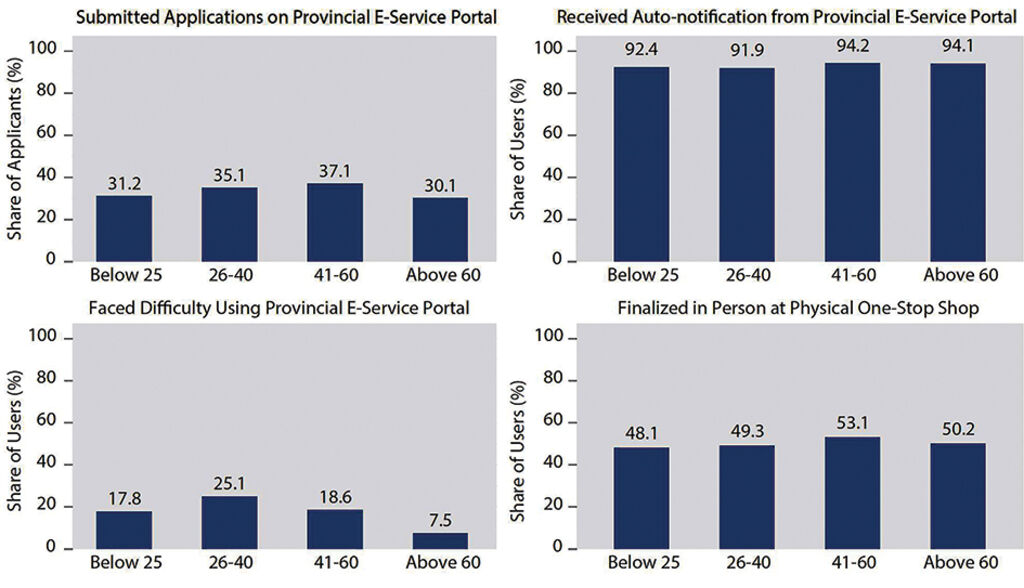 |
| Figure 8: Users’ experience with application for administrative procedures on Provincial E-Service Portals by age, 2023 |
Citizen experience with processing administrative procedures on the National E-Service Portal
This section presents PAPI survey results on citizen assessment of access to the NESP,[16] which is the national online OSS for citizens and businesses to access public administrative procedures. Apart from requesting local governments to provide more services online, the Government has invested in the NESP since 2019.
Figure 9 shows an increasing number of citizens accessing and setting up user profiles on the NESP, although still at a slow pace. As earlier reported, about 8.3 percent of PAPI respondents accessed the NESP in 2023, almost doubling the 2022’s figure. Also, the percentage of those who set up accounts on the NESP doubled, from 3.05 percent in 2022 to 6.39 percent in 2023. The 2-percentage point difference between those who visited the NESP and those setting personal accounts for future use, therefore, becomes significant, as it indicates that not all visited the national portal for e-services but also for other purposes.
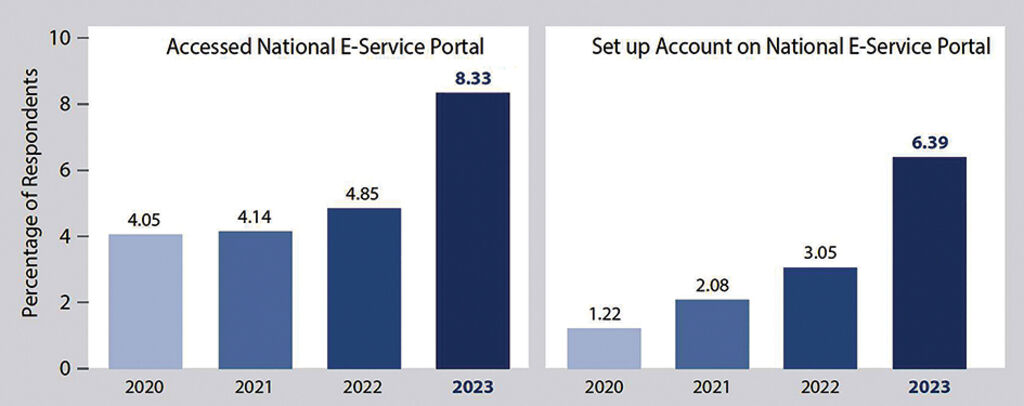 |
| Figure 9: Access to National E-Service Portal, 2020-23 |
In addition, the PAPI surveys ask respondents about their purposes for using the NESP. Figure 10 shows that, among those who accessed the portal in 2023, 54 percent used it for handling administrative procedures, a significant increase from 38 percent in 2022. Meanwhile, the percentage of users who searched for information in 2023 has fallen by a half from 61 percent in 2021. One important function of the portal is to collect users’ feedback. However, this only attracted 2 percent of users over the past three years.
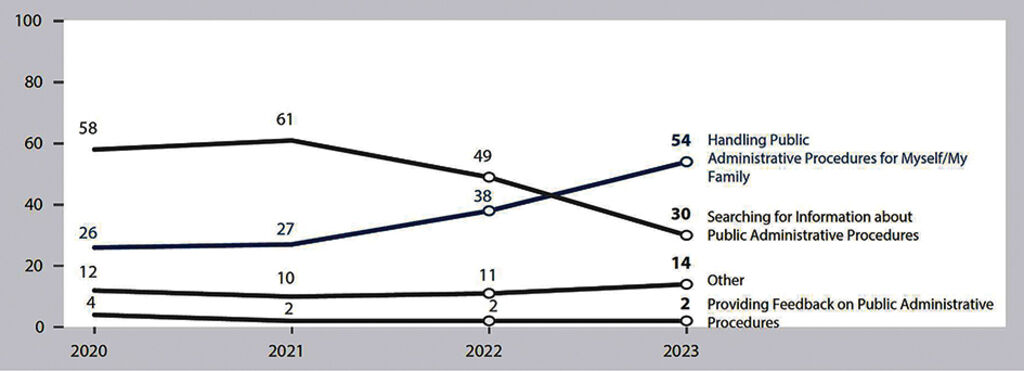 |
| Figure 10: National mean percentage of users of National E-Service Portal by purpose, 2020-23 |
Conclusions and policy implications
This article has presented a somewhat optimistic view of e-governance improvement based on the 2023 PAPI survey findings compared with previous years. This is particularly true in terms of internet access and use of e-service portals for citizen-centric public administrative procedures. However, it also highlights the limited progress made in governments’ engagement of citizens in policy-making on government portals and responding to citizens’ feedback online.
As the article reveals, although there was a significant increase in the number of national and provincial e-service portal users over 2022 and 2023, the percentage of citizens who used the portals for handling administrative procedures remained low. Furthermore, half of online service users could not pay for the service via portals and had to attend a physical OSS to finalize their applications. Users’ concerns about personal privacy when using national and provincial e-service portals remained prevalent. These weaknesses are suboptimal for any online service that aims to facilitate convenience for users, especially for those who live far from OSSs. Nevertheless, a promising aspect of e-services is that applicants for public administrative services online reported a higher level of satisfaction with the services.
Importantly, this article highlighted areas of a prevalent digital divide between different population groups and provinces with different socio-economic conditions. The findings indicate the need for central and local governments to work toward narrowing gaps in terms of access to e-government and e-services within gender, age, ethnicity, place of residence, and residential status at either the national or provincial level or both levels. With nearly one-fifth of the population not having access to the internet, more than two-fifths of the population not having personal computers at home, and about 10 percent not having smartphones, while e-services have not proven friendly on a single device like smartphones yet, central and provincial governments still need to address the basic connection infrastructure to facilitate internet and mobile phone coverage and provide internet-connected computers to OSSs in rural, mountainous, remote and ethnic minority areas.
It is suggested that, despite recent efforts to push the electronic and digital government agendas ahead, which have also been appreciated by PAPI respondents who have used online public services, central and provincial governments need to make substantial improvements to the NESP, PESPs and local government portals to make them more accessible, user-friendly, convenient and inclusive for all citizen-users. A practical measure that central and provincial governments should take to promote the use of the NESP and PESPs is to design and adopt a single-device approach to the online public service portals, so that users can access them from anywhere with their smartphones. In the meantime, traditional OSSs should receive further investment to provide offline and online services for those who do not have smartphones or access to electricity and internet yet.-
[1] The Vietnam Provincial Governance and Public Administration Performance Index (PAPI) reflects the feedback from respondents that are randomly selected to represent the views of a broad spectrum of Vietnamese citizens, aged 18 years and above, from various demographic backgrounds. Following the initial pilot in 2009 and a larger survey in 2010, the PAPI survey has been implemented nationwide each year since 2011. For more information about the PAPI research and reports, visit www.papi.org.vn.
[2] “Digital divide”, in this report, refers to inequalities between individuals, households or groups of population of different demographic and socio-economic levels in access to information and technology and in the knowledge and skills needed to effectively use the information gained from internet connections and internet-based platforms as provided by governments.
[3] See Law Library at https://thuvienphapluat.vn/van-ban/Cong-nghe-thong-tin/Quyet-dinh-749-QD-TTg-2020-phe-duyet-Chuong-trinh-Chuyen-doi-so-quoc-gia-444136.aspx.
[4] See Law Library at https://thuvienphapluat.vn/van-ban/Cong-nghe-thong-tin/Quyet-dinh-06-QD-TTg-2022-De-an-phat-trien-ung-dung-du-lieu-ve-dan-cu-2022-2025-499726.aspx.
[5] See Law Library at https://thuvienphapluat.vn/van-ban/Cong-nghe-thong-tin/Nghi-dinh-42-2022-ND-CP-cung-cap-thong-tin-dich-vu-cong-truc-tuyen-tren-moi-truong-mang-518831.aspx.
[6] See the Ministry of Information and Communications (April 24, 2023).
[7] See CECODES & UNDP (April 2024). 2023 PAPI shows progress in citizen perceptions of local anti-corruption efforts and e-governance. Available at https://link.gov.vn/b7nVPrC5.
[8] See CECODES, RTA & UNDP (2024). The Vietnam Provincial Governance and Public Administration Performance Index (PAPI) in 2023. Available at https://papi.org.vn/wp-content/uploads/2024/04/PAPI2023_REPORT_ENG.pdf, pp. 28-30.
[9] See the analysis of ownership growth rates of different assets, including internet at home and smartphones, by PAPI respondents from 2011-22 at: https://papi.org.vn/wp-content/uploads/2023/04/2022-PAPI-Asset-Ownership-Rate_VIE_ENG.pdf.
[10] See Vietnam Law and Legal Forum (February 11, 2015) at https://vietnamlawmagazine.vn/new-law-on-promulgation-of-legal-documents-5061.html.
[11] It should be noted that the data from Binh Duong and Quang Ninh provinces are not included because of their poor data integrity.
[12] See the Ministry of Information and Communications (April 24, 2023). Vietnam aims to increase use of online public services. Available at: https://english.mic.gov.vn/Pages/TinTuc/tinchitiet.aspx?tintucid=157790. Accessed on January 22, 2024.
[13] See IPS and UNDP (July 2022). Review of Local Governments’ Implementation of Personal Data Protection on Online Government-Citizen Interaction Interfaces, 2022. Available at: https://papi.org.vn/eng/danh-gia-viec-bao-ve-du-lieu-ca-nhan-tren-cac-nen-tang-tuong-tac-voi-nguoi-dan-cua-chinh-quyen-dia-phuong-nam-2022/.
[14] See the series of thematic research on e-governance and privacy protection commissioned by UNDP and national partners from 2021 to 2024 at: https://papi.org.vn/eng/thematic-research-reports/?title=quan-tri-dien-tu.
[15] As found in the Ho Chi Minh City National Academy of Politics (HCMA) and UNDP (2021, 2022) and HCMA, Vietnam Sociological Association (VSA) and UNDP (2023) empirical research in nine provinces (Binh Phuoc, Dien Bien, Gia Lai, Ha Giang, Hoa Binh, Ninh Thuan, Quang Tri, Soc Trang and Tra Vinh). Available at: https://papi.org.vn/eng/thematic-research-reports/?title=quan-tri-dien-tu.
[16] The National E-Service Portal can be accessed at: https://dichvucong.gov.vn/p/home/dvc-trang-chu.html.


