Edmund J. Malesky and Do Thanh Huyen[1]
 |
| Officials at the Public Administration Service Centre of Da Teh commune, Lam Dong province, guide residents to use automated kiosks__Photo: VNA |
Background: 16 years measuring governance performance
Since its inception in 2009, the Vietnam Provincial Governance and Public Administration Performance Index (PAPI) has emerged as an important tool for monitoring, benchmarking and informing governance and public administration reforms in Vietnam. Sixteen years’ PAPI data is based on governance feedback from nearly 220,000 citizens aged 18 years old and above, who are randomly selected across Vietnam.
Through its annual reports and comprehensive longitudinal datasets, PAPI provides a unique, citizen-centric perspective on the performance, policy consultation, and implementation of local governments, spanning from the provincial down to the district and commune levels. The core purpose of the index is to provide an objective, citizen-driven assessment of government performance in governance, public administration and public service delivery. In effect, PAPI seeks to hold up a “mirror” that reflects how local governments perform from the perspective of the people they serve. The ultimate aim of this reflection is to use evidence to identify and rectify problematic areas, thereby improving governance and ensuring the quality of services for all citizens. This role allows PAPI to inform and support Vietnam’s public sector management and reform agenda.
Initially, the index measured six core dimensions: (i) Participation at Local Levels, (ii) Transparency, (iii) Vertical Accountability, (iv) Control of Corruption, (v) Public Administrative Procedures, and (vi) Public Service Delivery. In 2018, as Vietnam embraced digitization and faced mounting environmental challenges, the index expanded its framework to include two new dimensions: Environmental Governance and E-governance.
With 16 years of longitudinal data covering multiple dimensions of governance across all 63 provinces prior to the merger of provincial-level administrative units in 2025, PAPI constitutes a uniquely rich empirical resource for informing the implementation of Vietnam’s transition to a two-tier system of administration. At a time of significant institutional reform, PAPI’s findings are particularly relevant in offering evidence-based insights to policymakers and administrators, supporting efforts to ensure that the 2025 reforms contribute to more transparent, effective, inclusive and responsive governance. The aim of this paper is to highlight some of PAPI’s key historical findings that may be of particular relevance for the successful implementation of the ongoing reforms and offer recommendations on how to build on positive trends and address persistent challenges in public administration at the local level.
PAPI findings from 2010 to 2024: positive trends and persistent challenges
Sixteen years of PAPI data presented in this article are particularly relevant to the latest developments in Vietnam. More specifically, PAPI analysis captured in the annual PAPI Reports from 2010-24[2] reveals trends and patterns in provincial governance and public administration performance that are of relevance to efforts to adapt and enhance local level administration. As the administrative structure has changed, more should be done to build on what has been improved and address persistent challenges to ensure that the new two-tier government system delivers on its reform commitments.
Stagnation and inequality in citizen experiences with local governance
Analysis of the unweighted PAPI scores over time reveals two concerning patterns. First, the median score - measured across both the original six dimensions and the newer eight-dimensional index - has not improved significantly over time. Scores on the six-dimensional index ranged from a high of 37.2 in 2012 to a low of 34.4 in 2015. The eight-dimensional index actually dropped steadily after a high in 2018, with only minor recovery in 2019. Second, and perhaps more worryingly, since 2018 we have observed rising inequality in citizens’ experience with governance across provinces. As Figure 1[3] shows, the standard deviation in governance was at its lowest in 2018 but has increased incrementally since that low point. This data demonstrates that the overall level of governance is “stuck,” and there is greater inequality among the recipients of public services. These trends appear to be primary motivations for the dramatic merger of provinces and the removal of the district level of government.
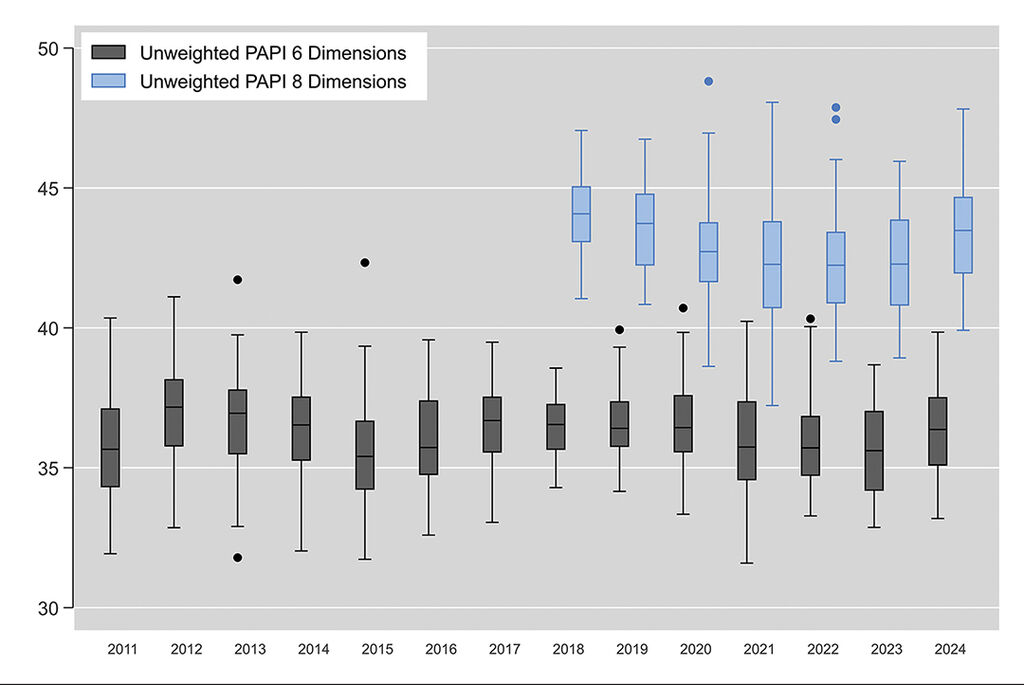 |
| Figure 1: Limited improvement and high variance in governance over time |
When disaggregated by demographics, PAPI Reports over the years consistently highlight significant inequalities in citizen experience with local governance and public services. The 2024 PAPI data, for instance, shows substantively small but statistically significant different experiences with governance between men and women, urban and rural areas, migrants and long-term residents, and ethnic Vietnamese (Kinh) and minorities.[4] We observe the largest disparities between those connected to the leadership and administrative structure through Party membership and those without outside connections.
Control of corruption has improved, but problems remain
When asked about their issues of greatest concern, PAPI respondents consistently reported corruption among the Top 10 over the past 16 years. In 2024, corruption was the issue of greatest concern, with a record number of 22.6 per cent of respondents citing it. The prevalence of this concern is in sharp contrast with the anti-corruption campaign and the rapid reductions in bribery for citizen-centric public services such as healthcare, primary education and public administrative procedures that were evidenced in PAPI data.[5] Ultimately, the PAPI data shows that while citizen perception of local governments’ performance in control of corruption improved dramatically (see Figure 2), a significant share of citizens remain concerned about corruption.
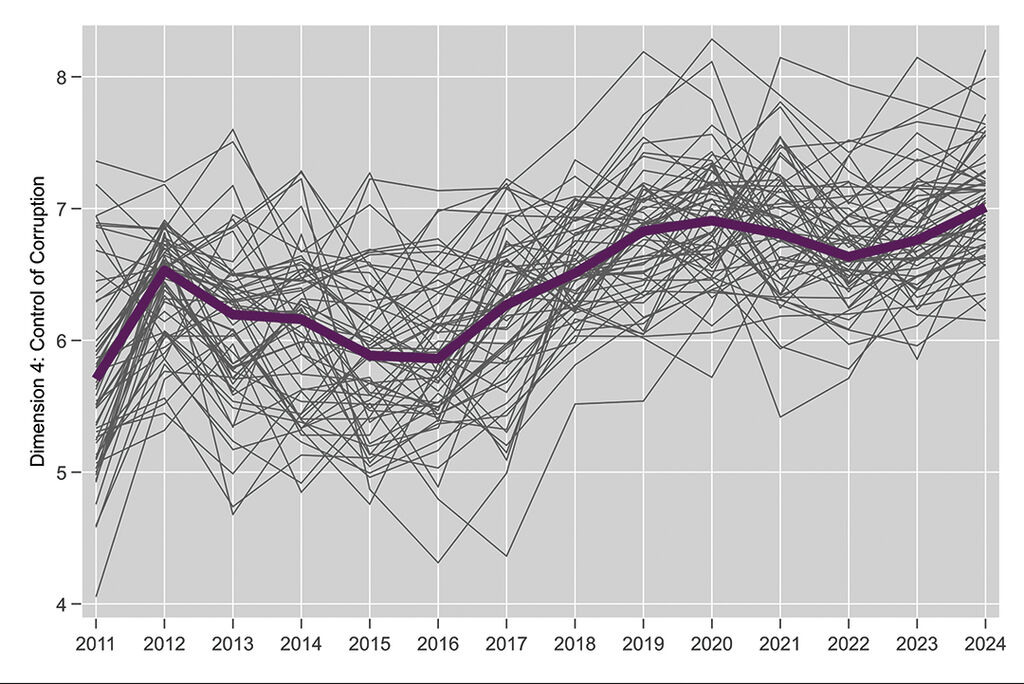 |
| Figure 2: Control of corruption performance improving generally |
Moreover, corruption prevalence and reductions vary heavily by type of corruption practice. The decline in petty corruption (small bribes for necessary procedures and services) occurred at a faster rate than grand corruption (large-scale bribes impacting major projects and policy). The PAPI data from 2011 to 2024 shows that while control of corruption improved consistently across the 63 provinces, the progress varied heavily by type. Figure 3 illustrates several individual types of bribery over time, showing a marked rise in the share of respondents reporting that petty bribery (to teachers and doctors) was “not common,” particularly after the 2016 launch of the anti-corruption campaign (denoted by the dashed red line). In contrast, indicators of grand corruption (land titles, construction kickbacks and diversion of public funds) show slower or smaller improvements. By far, the slowest reduction in bribery was recorded for payments to procure state employment. While the upward trajectory since 2016 is indeed positive, it is important to note that for all types of petty corruption that PAPI tracks, a substantial share of the population still believes bribery is a problem in 2024, ranging from 25 per cent when it comes to bribery to primary teachers for better education and 45 per cent when it comes to state employment.
Together, the three figures suggest that while citizen perception of overall control of corruption has strengthened substantially, reforms have been more effective at curbing everyday service-level bribery than at dismantling entrenched, high-level bribery activities, and there is still enormous work to do across all bribe types.
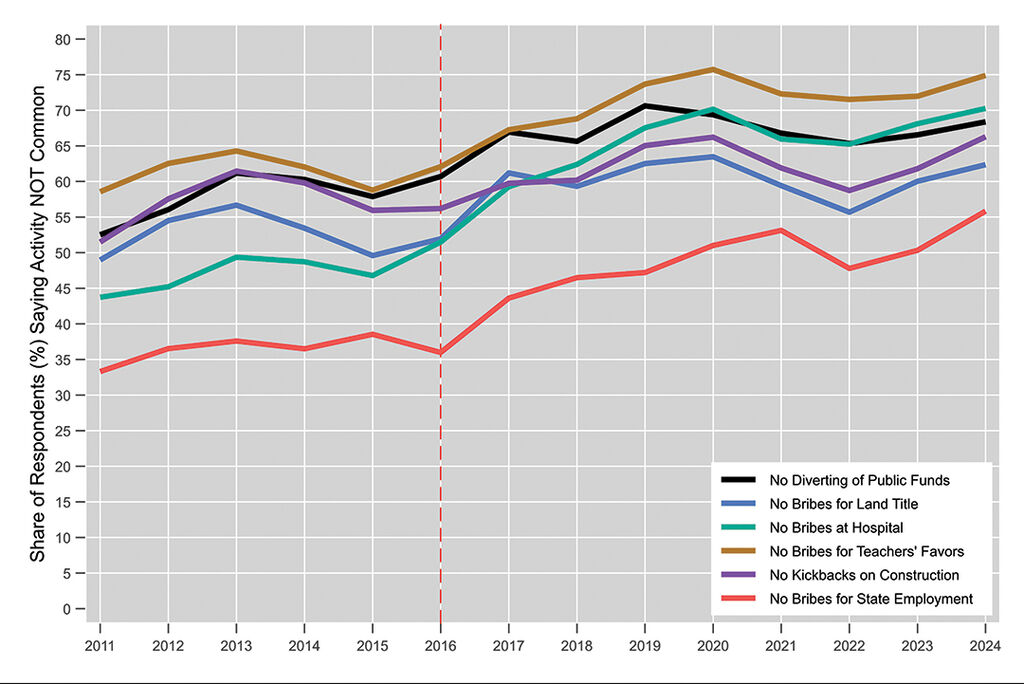 |
| Figure 3: Differential improvements in corruption types |
Declining transparency in local decision-making
Citizen perceptions of openness regarding local decision-making, especially concerning land use planning and local budgets, have been on a decline for more than a decade. Figure 4 illustrates this decline, showing a drop from a score of 5.86 to 5.12 by 2023. Despite a minor recovery in 2024, current transparency levels remain significantly lower than they were a decade ago.
PAPI data also reveals a constant lack of land information for citizens. Since 2011, fewer than 20 per cent of people have been aware of local land use plans. Similarly, while the number has fluctuated, only slightly more than 40 per cent of citizens were informed of the expenditures in the commune budget for the entire period, with the shares declining especially from 2021 to 2024. In-depth research on the disclosure of both online and offline local land plans[6] and local budget planning and expenditures[7] confirms the problem. Commune governments often miss deadlines for sharing information, and when they finally do share it, the formats are confusing or inaccessible.
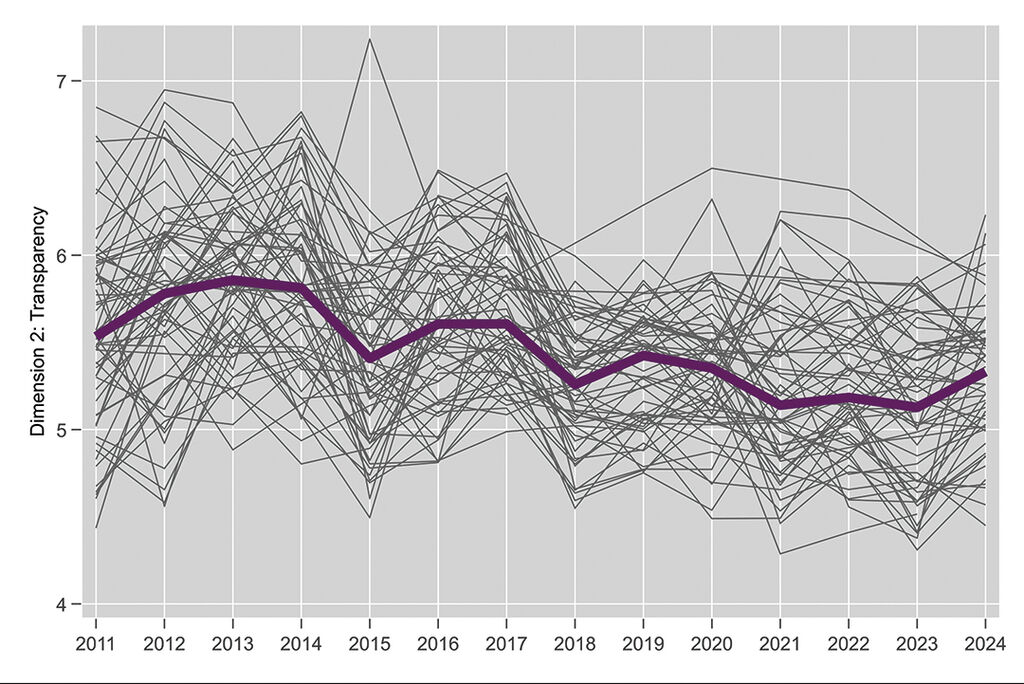 |
| Figure 4: Declining transparency over time |
Chronic limitations in vertical accountability towards citizens
The accountability of local officials to citizens has been a significant area of public concern, with many citizens feeling their feedback and complaints not adequately addressed. This is evidenced by a dramatic reduction in provincial performance on responsiveness over time: scores dropped from a high of 5.72 in 2014 to a low of 4.27 in 2023, recovering some ground in 2024. Crucially, these declines are not caused by a lack of citizen engagement. The share of citizens contacting commune-level People’s Committees actually increased from a low of 7.5 per cent in 2013 to a high of 18.7 per cent, remaining above 17 per cent today. Instead, the decline stems from the willingness of citizens to take formal steps such as sending queries, complaints or proposals to the local governments to hold officials accountable and the ability of local officials to respond.
As shown in Figure 5, there was a dramatic decline in the sub-dimension score on local government responsiveness from 1.9 in 2015 to 0.5 in 2024. Evidently, the share of citizens who were willing to take an accountability action, including making a proposal, lodging a complaint, denouncing an agency, or signing a joint petition, decreased over time. These shares can be seen in the bottom right panel in Figure 5 below, showing a remarkable dive from 27 per cent in 2018 to 18.5 per cent in 2023. Even more worrisome, the share of citizens rating the response to those actions as successful declined from 23 per cent to 17 per cent over the same period. While responsiveness ticked up in 2024, the numbers remain low. Only 20.6 per cent of citizens who had a concern took an action, and only 18.1 per cent of those received a worthwhile response, meaning that less than 4 per cent of citizens with a concern saw that issue resolved in 2024.
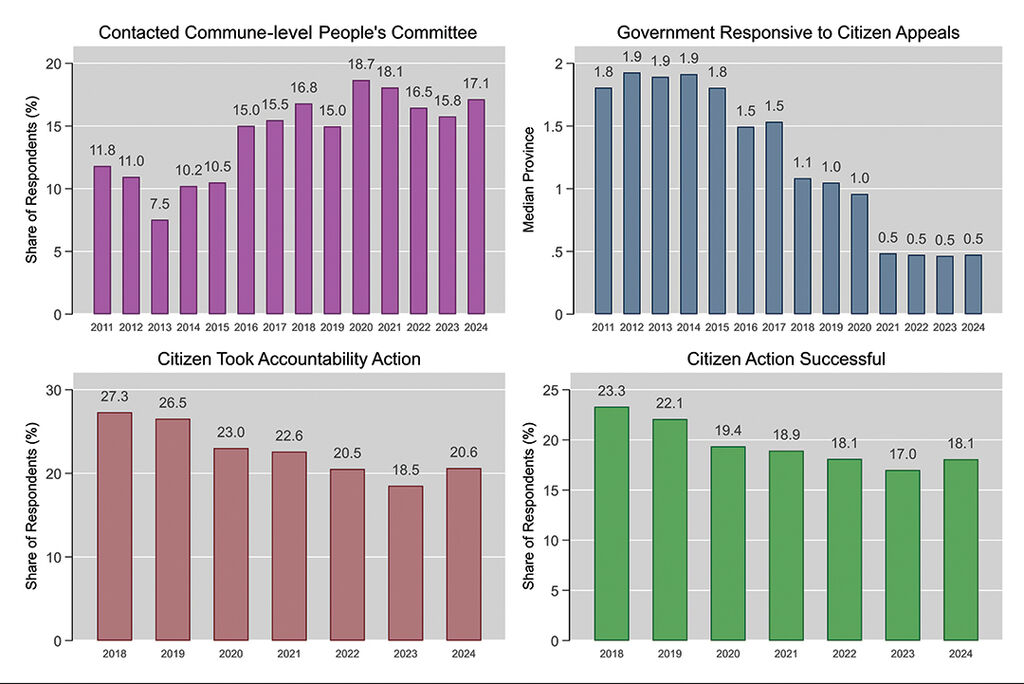 |
| Figure 5: Declining local government responsiveness |
Stubbornly burdensome public administrative procedures
Despite numerous reform efforts, many citizens still find administrative procedures to be cumbersome and time-consuming. Progress in improving administrative procedures was sharp in the early years of PAPI measurement but has largely stalled in recent years.
Overall improvements in administrative efficiency plateaued after 2020, with most provinces maintaining similar performance levels and little upward movement in transparency or simplification. Deeper analysis shows that, while procedures for obtaining land titles have become somewhat more consistent across provinces, the overall ease of completing them has declined slightly, with the median share of respondents reporting smooth processes stabilizing around 80 per cent. This suggests that the simplification of public administrative procedures needs continued acceleration, including through the reform of local “single windows” at scale.
The paradox of e-governance and online public services
While e-governance has shown gradual improvement since 2020, it still scores relatively low amongst citizens. In 2024, the average score was just over 3 on a 10-point scale (see Figure 6). While internet access is high - 89 per cent in urban areas and 80 per cent in rural areas, actual usage of e-governance tools lags behind.
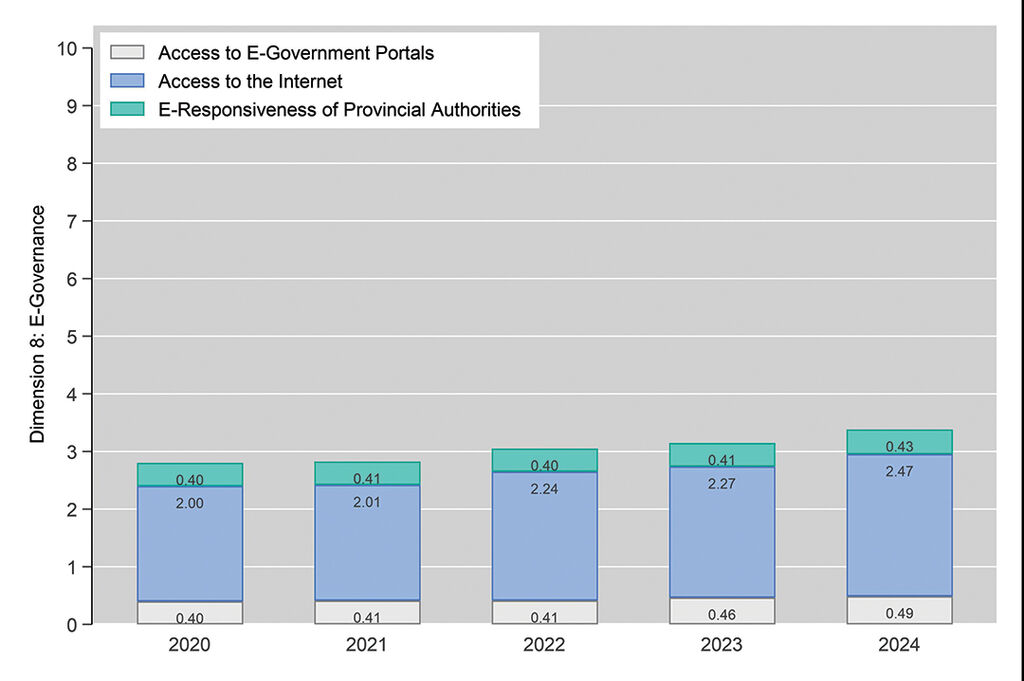 |
| Figure 6: Slow but incremental progress on e-governance |
Looking closer at specific services being provided on national and provincial e-governance portals over the period from 2020 to 2024, there was an increase in the number of respondents processing administrative procedures online, but the share searching for information and providing feedback declined to extremely low numbers.[8] Four key reasons for this lack of usage are: (i) Limitations in technical infrastructure, network connectivity, and IT equipment, especially in remote areas; (ii) Low awareness and capacity among both civil servants and citizens in utilization of online public services; (iii) Lack of the ‘user-first’ mindset in the design of e-service portals; and (iv) Cumbersome public administrative procedures.[9]
These problems may continue, as provincial service portals have been abolished since July 1, 2025, while the National Service Portal is not yet ready to provide end-to-end services in most public administrative procedures. This may lead to increasing disparities in the quality of e-governance across regions, exacerbating the difference between national-level cities and more rural provinces that can be observed in Figure 7.
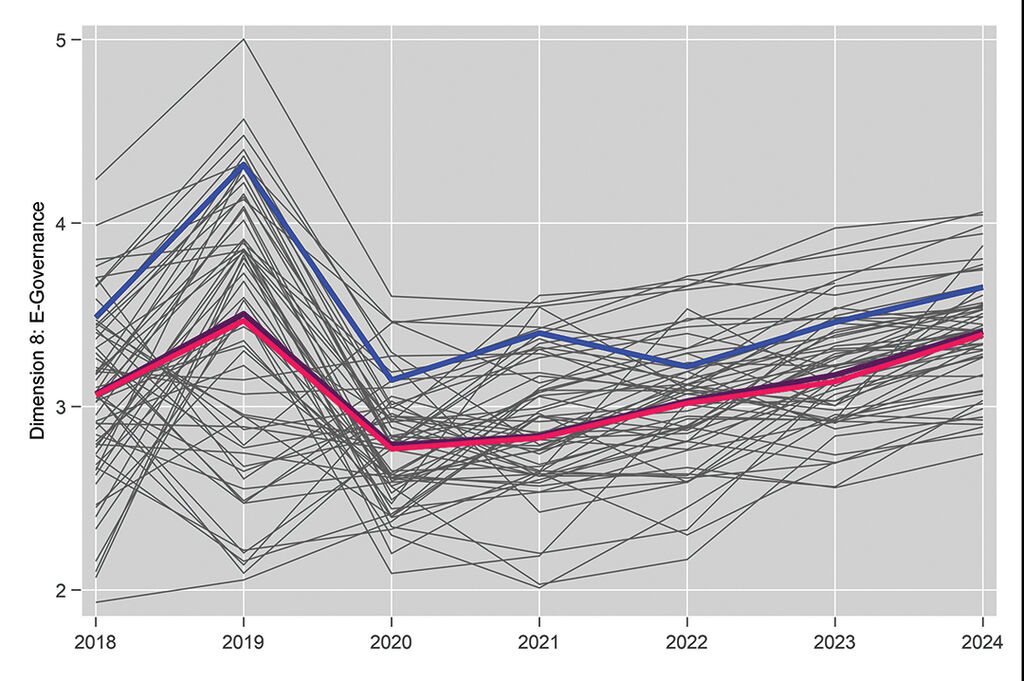 |
| Figure 7: Persistent gaps in e-governance |
Note: The trace graph presents three estimates. The median national-level city (blue), the median province (pink), and the combined median (purple). Note that respondents in cities have consistently better e-governance over the measured period, a gap that appears to be increasing rather than narrowing.
Policy implications for the two-tier government system
Sixteen years of PAPI data and the trends and patterns they evidence have several direct policy implications for the ongoing transition to a two-tier administrative system.
Strengthening vertical accountability towards citizens: With the removal of the district level, the remaining provincial and commune tiers will have more direct power, authority and responsibility. This necessitates stronger accountability mechanisms to ensure provincial leaders remain connected to local realities and responsive to citizens. PAPI can be the primary tool for measuring this when used as one of the indices to evaluate provincial government leaders.
Heightening need for non-administrative boundary public services: These disparities in inclusive governance and access to public services may widen post-2025 because the mergers of provinces and communes will move new commune government seats further away from citizens living in remote areas, particularly those near the boundaries of new communes and in mountainous regions. Addressing the physical access to both participatory opportunities and public services for these remote communities will require forthright actions from central and provincial governments.
Managing transition risks: The administrative restructuring carries risks of disruption to the smooth and effective functioning of both local governments and public services, of deepening disparity for citizens in remote communities and vulnerable groups, and of increased corruption as new power dynamics emerge. PAPI can serve as an early warning system to identify and mitigate these risks.
Establishing baselines for the new local government system: PAPI data provides a crucial baseline to measure whether the transition to a two-tier system improves governance and public service delivery from the citizens’ perspective. It can serve as a foundational component for the “digital dashboard” to monitor the reform’s success. With baseline data, PAPI can serve as a pivotal tool to facilitate and motivate policy action right from the beginning of the new local government system.
Guiding decentralization and capacity building: The rich time-series data allows for longitudinal trend analysis, helping identify which provinces and communes are prepared for greater responsibilities and where targeted capacity building is needed. Commune government officials and civil servants will require clarity in decentralized authorities and further assistance to undertake new, integrated mandates after the merger of ministries and the removal of district governments.
Ways forward: recommendations for a successful transition
To address the historical gaps identified by PAPI and ensure a successful transition to a two-tier government system, the following actions are recommended:
Strengthen mechanisms for transparency and citizen participation: Addressing the transparency deficit - particularly in land use and state budgets - is crucial for rebuilding public trust and empowering citizens to hold their leaders accountable. The government must enforce existing regulations on the public disclosure of information, particularly regarding land use plans, local budgets and major infrastructure projects. Furthermore, promoting the use of online portals and community meetings to facilitate genuine public consultation is required for a modern governance system.
Implement targeted anti-corruption measures: A data-driven approach to anti-corruption will be more effective than broad campaigns and will demonstrate a tangible commitment to tackling corruption. Based on the findings regarding state employment and land titling, targeted integrity-building measures must be implemented. These should include enhanced oversight of state employment and digitalizing land titling administrative procedures.
Address disparities in public service delivery: Ensuring equitable access to quality public services is a core function of government and is essential for inclusive development. Provincial governments should develop and implement specific action plans to address the service delivery gaps experienced by rural communities, ethnic minorities, and migrant populations. Progress should be tracked through the multi-dimensional “digital dashboard.” Additionally, national government agencies must coordinate to make a single data warehouse available across the public sector. This will facilitate borderless e-service provision, ensuring that every Vietnamese citizen can access e-services regardless of their residency status or location.
Integrate PAPI into the new system’s performance appraisals: It is important to incorporate key PAPI indicators into the official performance evaluation framework for Chairpersons of provincial- and commune-level People’s Committees under the new two-tier system, as envisioned by Regulation 365-QD/TU. This integration creates a direct link between citizen satisfaction and the evaluation of leaders managing the new, streamlined administrative structure. By doing so, the Government ensures that the “voice of the people” becomes a formal metric for career advancement and retention, specifically for the 2026-30 government term.
Develop a “digital dashboard” for the two-tier reform: It is pivotal to create a standardized “digital dashboard” that focuses on monitoring the transition from a multi-dimensional perspective rather than economic numbers. The dashboard should visualize pre-reform data against post-reform data to track progress and identify challenges in real-time. Such a tool provides a transparent, evidence-based tool for officials to manage the reform effectively.-
[1] Edmund J. Malesky, Professor of Political Economy, Duke University; Scientific Director Green-X at VinUniversity; and, Do Thanh Huyen, Policy Analyst and PAPI Programme Manager, the United Nations Development Programme in Vietnam.
[2] See the series of PAPI Reports from 2009 to 2024 at https://papi.org.vn/eng/bao-cao/.
[3] This graph depicts two box plots based on the unweighted (direct sum of the PAPI dimensions) of all 63 provinces. Grey boxes are the sum of the original six PAPI dimensions (Participation, Transparency, Vertical Accountability, Control of Corruption, Administrative Procedures, and Public Service Delivery). Blue boxes add the two expanded dimensions of Environmental Governance and E-Governance. Each box plot displays the median, represented by the line in the middle of the graph, the 75th percentile (the top of the box), the 25th percentile (the bottom of the box), and the minimum and maximum values, represented by the whiskers at the end of each range bar. Outliers are depicted as individual dots.
[4] See research findings about challenges facing internal migrants in inclusive governance and public services at https://papi.org.vn/eng/thematic-research-reports/?title=quan-tri-va-di-cu-noi-dia.
[5] See the findings on page 17 of 2024 PAPI Report at https://papi.org.vn/wp-content/uploads/2025/04/PAPI_2024_REPORT_ENG_final.pdf.
[6] See CEPEW and UNDP (2021-2024). Annual Review of Online Disclosure of Land Information in 2021, 2022, 2023 and 2024. Available at: https://www.congkhaithongtindatdai.info/ and other land governance-related studies at https://papi.org.vn/eng/thematic-research-reports/?title=quan-tri-dat-dai.
[7] See VESS, CDISE and UNDP (2023-2024). Annual Review of Disclosure of State Budget Plans and Expenditure by Local Governments. Available at: https://papi.org.vn/eng/thematic-research-reports/?title=minh-bach-ngan-sach.
[8] See 2024 PAPI Report, p. 23, at papi.org.vn/wp-content/uploads/2025/04/PAPI_2024_REPORT_ENG_final.pdf
[9] See more findings from a series of action research in various provinces and online review of national and provincial service portals at https://papi.org.vn/eng/thematic-research-reports/?title=quan-tri-dien-tu.